High-ticket industrial products and services are not often sold after one click, one visit, or one form submission. Buyers compare suppliers, review specifications, involve engineering, ask procurement to validate terms, and may return months later with a request for quote (RFQ).
That makes the standard marketing dashboard a poor fit for many manufacturers. Traffic, clicks, impressions, and lead totals show activity, but they do not reveal whether marketing is attracting qualified buyers, supporting sales conversations, or contributing to the pipeline.
Quick View
- Judge marketing by qualified demand, RFQs, accepted leads, pipeline, and revenue rather than activity alone.
- Define MQLs, SQLs, opportunities, and disqualification criteria with sales before building the dashboard.
- Match each channel and content stage to the metric that best reflects its purpose.
- Treat attribution as directional because industrial buying often includes offline and untracked activity.
- Use monthly reporting to guide decisions, not simply record results.
What Are Manufacturing Marketing Metrics?
Manufacturing marketing metrics are key performance indicators (KPIs) that show whether marketing is attracting suitable industrial buyers, helping them through technical evaluation, and supporting revenue.
For long sales cycles, useful metrics connect website activity with RFQs, qualified leads, target-account engagement, sales conversations, pipeline, and closed-won deals.
You do not need more numbers. You need a smaller set of numbers that sales and leadership trust.
Why Vanity Metrics Mislead Manufacturers
Vanity metrics have a place, but they become misleading when they are presented as proof of growth without any measure of buyer quality.
Traffic without qualified demand
A jump in website traffic looks promising until sales asks where the opportunities are.
For manufacturers selling custom machinery, engineered components, automation systems, or industrial services, irrelevant traffic can waste time. Students, job seekers, vendors, hobbyists, and poor-fit buyers can all increase traffic without adding sales value.
Google Search Console reports clicks, impressions, click-through rate, and average position. Those figures still need to be connected to visitor quality and on-site behavior.
Instead of asking, “Did traffic increase?” ask, “Did the right buyers visit the right pages and take a meaningful next step?”
Clicks without buying intent
A paid search ad can attract people who will never buy. A broad SEO article may rank well while drawing readers outside the target market. A social post may generate engagement from peers rather than prospects.
For industrial products and services, search intent matters more than traffic volume.
A plant engineer researching a specific failure mode carries different value from someone browsing general manufacturing trends. A procurement manager searching for a certified supplier carries different intent from someone reading a broad industry article.
Both visits count as clicks. Their commercial value is very different.
Leads that sales cannot use
Raw lead volume is easy to inflate.
Contact forms, gated downloads, webinar registrations, RFQs, distributor inquiries, and job inquiries may all be recorded as leads unless forms and customer relationship management (CRM) records separate them. The result is a noisy report that says little about sales potential.
Salesforce Account Engagement uses lifecycle stages such as Visitor, Prospect, Marketing Qualified Lead, Sales Qualified Lead, and Won Opportunity. HubSpot also categorizes contacts and companies according to their position in the marketing and sales process. These systems reflect the need to separate early engagement from sales-ready demand.
Manufacturers should define each stage in plain language before building a dashboard.
Short-term reporting for long buying cycles
A sale may involve months of research, several stakeholders, technical validation, budget timing, and multiple quote revisions.
For manufacturers with long and complex buying processes, the recommended strategy is combining inbound marketing, account-based marketing, CRM workflows, sales enablement, RFQ tracking, and pipeline reporting instead of focusing on lead totals alone.
Short reporting windows can make valuable channels look ineffective. SEO, technical content, email nurturing, and account-based campaigns may influence a buyer long before an RFQ appears. Giving all credit to the final form submission hides the work that created the opportunity.
Gartner reported in 2026 that 67% of B2B buyers prefer a rep-free experience. Digital content and self-service research are therefore part of the sales process before a representative becomes involved.
What Manufacturers Should Measure
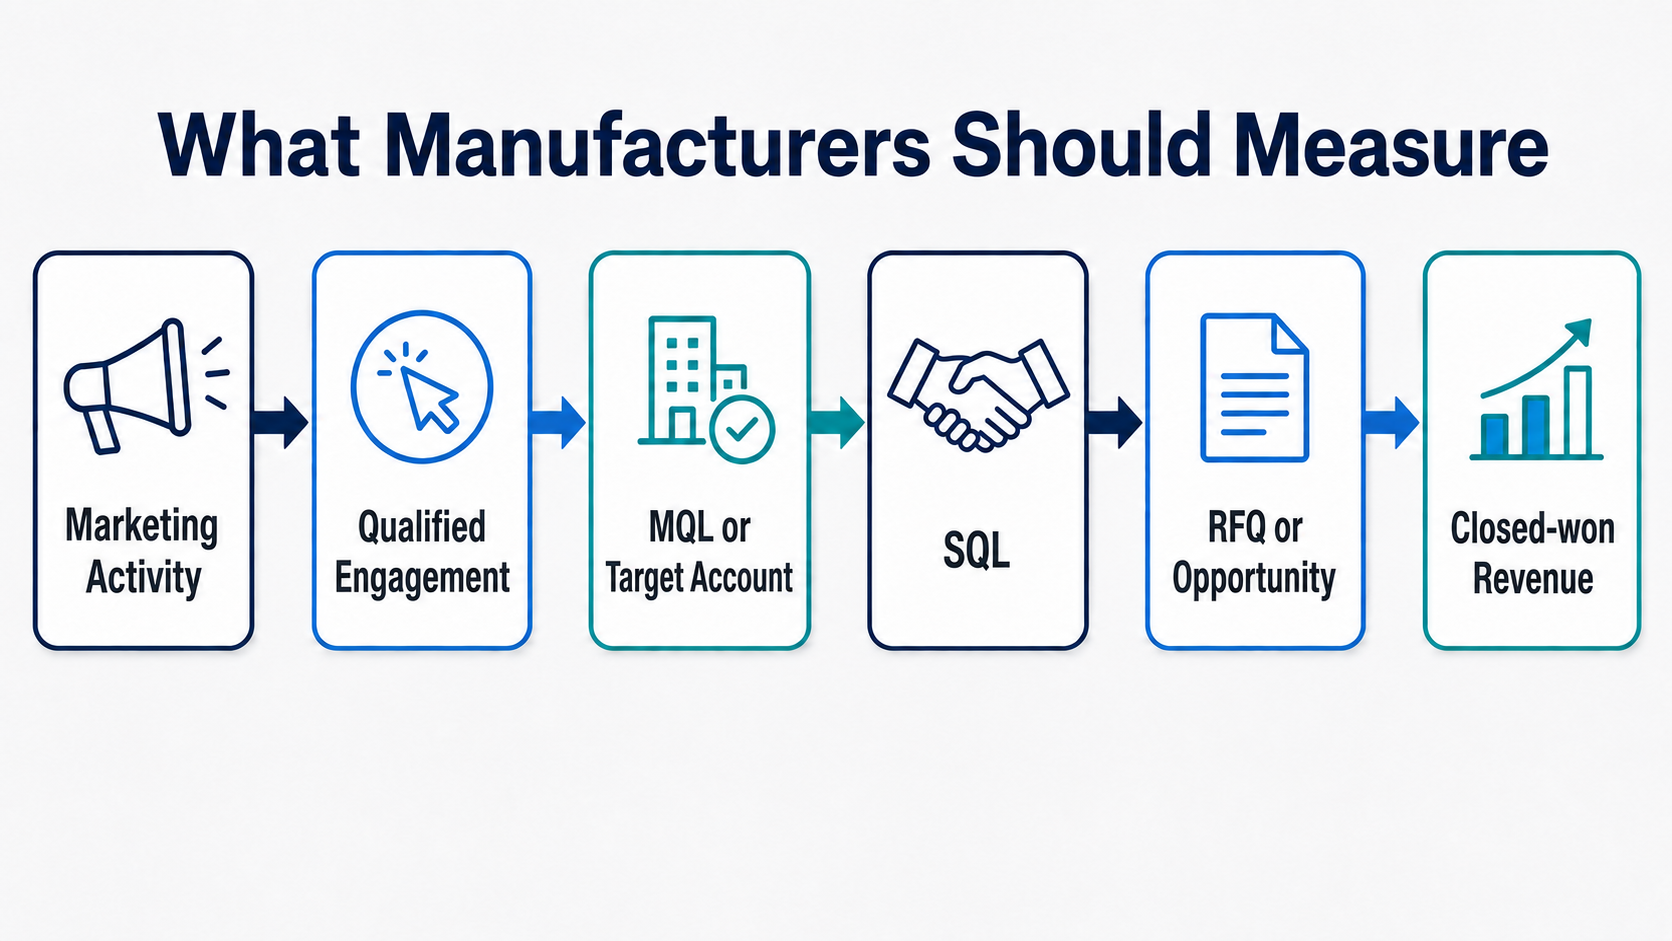
Useful industrial marketing KPIs show buyer quality, movement through the sales process, and connection to revenue.
| Metric | What it tells leadership | Why it matters |
| Qualified website conversions | Whether suitable visitors are becoming usable inquiries | Separates activity from demand |
| RFQs | Whether buyers are ready to discuss a specific need | Connects marketing with sales action |
| Sales-qualified leads | Whether sales accepts and works the lead | Creates a shared definition of quality |
| Target-account engagement | Whether named accounts are interacting with marketing and sales | Supports account-based marketing |
| Content engagement by buying stage | Whether buyers use content during research and evaluation | Shows how content supports long sales cycles |
| Pipeline influenced | Whether marketing touched CRM opportunities | Connects marketing with revenue movement |
| Closed-won source or influence | Which channels appear in won-deal histories | Supports budget decisions |
This gives executives a clearer view and gives marketing and sales a shared language.
What Is A Qualified Website Conversion?
A qualified marketing lead (MQL) from a website conversion is an action taken by a visitor who fits the target market and shows meaningful intent.
Examples include:
- An RFQ from a target industry
- A contact form from a suitable company
- A technical consultation request
- A CAD file, drawing, or specification submission
- A distributor inquiry from an approved region
- A phone call from a product or capability page
- A download from a known target account
- A return visit to pricing, case study, or application content
Google Analytics 4 allows teams to mark business-critical actions as key events. For manufacturers, those events should represent meaningful buyer behavior rather than every low-intent interaction.
A brochure download may have value. An RFQ usually has more.
What Is A Sales Qualified Lead?
A sales qualified lead (SQL) is a lead that sales accepts for direct follow-up.
Manufacturing SQL criteria may include:
- Target-industry fit
- Product or capability fit
- A real application need
- Budget or project scope
- Geography or service area
- Technical requirements
- Buying role or influence
- Problems with the current supplier
- RFQ details or supporting documents
Marketing and sales should agree on these criteria before evaluating campaign performance.
Without a shared definition, marketing reports high lead volume while sales reports poor lead quality. Both views can be accurate.
RFQs – Marketing’s Gold Standard
RFQs are among the clearest marketing metrics for manufacturers because they signal active buying interest.
Their quality still varies. A useful RFQ report should separate:
- Suitable and unsuitable RFQs
- New-customer and existing-customer requests
- Product line or capability
- Company size or account tier
- Estimated opportunity value
- Quote status
- Win or loss reason
Counting RFQs is only the starting point. The report should also show which activities produce opportunities that sales want to pursue. When an RFQ becomes a sale, the true success of both marketing and sales alignment is demonstrated.
Target-account Engagement
For many businesses, one strong account may be worth more than hundreds of unsuitable website visits.
Target-account engagement measures whether priority companies are interacting with marketing and sales.
Useful signals include:
- Visits from named accounts
- Repeat visits to product, application, and case study pages
- Engagement with nurture emails
- Webinar attendance
- Sales conversations that begin after marketing activity
- Engagement from several contacts at the same company
- Movement from anonymous company activity to known contacts
Account-based marketing for manufacturers is a focused approach built around account identification, tailored messaging, sales alignment, and performance monitoring.
For an OEM, distributor, or industrial service provider, the better question is, “Are the accounts we want paying attention?”
Content engagement by buying stage
Technical content should be evaluated according to the job it performs, not by pageviews alone.
| Buying stage | Content type | Better metric |
| Problem recognition | Troubleshooting articles and application explainers | Qualified organic visits, scroll depth, return visits |
| Research | Buyer guides, material explainers, and process pages | Downloads, engaged sessions, internal clicks |
| Supplier comparison | Case studies, capability pages, and certifications | Repeat visits, target-account activity |
| RFQ preparation | RFQ guides, product pages, and specification checklists | Form starts, RFQs, and calls |
| Sales support | One-pagers, comparison pages, and technical FAQs | Sales usage and opportunity influence |
A product engineer may read several technical articles before asking procurement to contact suppliers. A plant manager may forward a case study internally. A procurement lead may return later through a branded search. They are all engaged with different content, serving different purposes.
The content contributed even when it did not receive the final click.
Pipeline influenced
Pipeline-influenced reporting shows whether marketing touched opportunities that entered the CRM.
Attribution requires care. Google Analytics assigns credit across ads, clicks, and other touchpoints that occur before a key action. The model can reveal patterns, but it cannot capture every offline conversation, distributor referral, trade-show discussion, phone call, forwarded email, or sales note.
Manufacturers should treat attribution as directional evidence rather than an exact record.
Useful questions include:
- Which channels appear before qualified RFQs?
- Which pages appear in closed-won opportunity histories?
- Which campaigns engage priority accounts?
- Which content helps sales restart stalled opportunities?
- Which sources produce poor-fit leads?
Strong reporting combines analytics, CRM records, sales feedback, and opportunity reviews.
Closed-won source or influence
Closed-won reporting should show which marketing activities appeared in deals that became revenue.
This may include:
- Original source
- Latest source before inquiry
- Campaign influence
- First conversion
- Last conversion
- Content viewed before the RFQ
- Sales-recorded source
- Account-engagement history
- Opportunity amount
- Win reason
Industrial buying paths are often complicated. A buyer might discover the company through SEO, return through a branded search, attend a webinar, speak with sales at a trade show, and submit an RFQ months later.
A useful dashboard shows that sequence without claiming more certainty than the data supports.
How to Connect Marketing Activity With Revenue
A reliable measurement system starts with shared definitions, followed by tracking and reporting.
1. Define lifecycle stages
Create a shared definition for every stage.
A manufacturing lifecycle might include:
Visitor: An anonymous website visitor or identifiable target-account visit.
Known contact: A form submission, email subscriber, event attendee, or existing CRM record.
Marketing-qualified lead: A contact who meets basic fit criteria and shows meaningful engagement.
Sales-accepted lead: A lead that sales agrees is worth follow-up.
Sales-qualified lead: A contact whose fit, need, and opportunity potential have been confirmed.
Opportunity: A deal record with an estimated value.
Closed-won or closed-lost: A recorded outcome with a reason.
The terminology can vary. Agreement matters more than the labels.
2. Set up CRM tracking
CRM records should capture the information sales needs to qualify and follow up.
Industrial forms may ask for:
- Company name
- Industry
- Role
- Product or capability interest
- Application
- Timeline
- Drawing or file upload
- Location
- Current challenge
- Preferred contact method
Form length should match intent. A newsletter form can remain brief. An RFQ form should collect enough detail for a useful response. Word of caution: While sales does need a lot of information to produce a quote, creating a form with too many fields to fill creates friction for the buyer. Only require the fields you absolutely need to know.
3. Connect forms, calls, email, and sales notes
Buyers often convert through several channels.
Track:
- Website contact forms
- RFQ forms
- Phone calls
- Chat conversations
- Email replies
- Sales-created opportunities
- Quote requests received outside the website
- Event and trade-show follow-up
- Distributor and representative referrals
When phone calls are missing from the data, a large share of industrial demand may disappear from the dashboard.
Inconsistent sales notes create a similar problem. Marketing cannot evaluate content or campaign influence when the supporting information is never recorded.
4. Review attribution with judgment
Attribution can identify recurring patterns, but it cannot replace human review.
Use attribution reports to find common paths, then compare those findings with sales conversations and opportunity records. Continue monitoring channels that repeatedly appear in strong opportunities. Adjust or stop campaigns that produce leads with no progression.
Metrics By Channel
Each channel needs its own measurement logic.
SEO: qualified organic inquiries and technical visibility
Track:
- Qualified organic inquiries
- RFQs from organic search
- Rankings for technical and high-intent keywords
- Organic visits to product and application pages
- Organic-assisted opportunities
- Search Console queries connected to buyer intent
Google Search Console reports clicks, impressions, click-through rate, and average position. Tracked keywords, website pages, premium content, social activity, email campaigns, and conversion rates are part of manufacturing SEO measurement.
A strong SEO report goes beyond rankings. It shows whether technical visibility produces qualified demand.
Paid search: cost per qualified inquiry
Track:
- Spend
- Cost per conversion
- Cost per qualified inquiry
- Cost per RFQ
- Search terms that produce suitable inquiries
- Lead quality by campaign
- Campaign-influenced pipeline
- Spend lost to irrelevant searches
Google Ads calculates cost per conversion by dividing total cost by the number of conversions. Manufacturers should add a quality filter. A low-cost conversion has little value when sales cannot pursue it.
Cost per qualified inquiry or qualified RFQ is usually more useful.
Account-based marketing: engagement and sales conversations
Track:
- Engagement from named accounts
- Engaged contacts per account
- Content viewed by buying-committee members
- Sales conversations opened
- Meetings booked
- Opportunities created
- Pipeline by account tier
ABM reporting should focus on accounts rather than lead totals.
An engineer, procurement manager, and operations leader from one target company may carry more value than 20 unrelated form submissions.
Email: reactivation and nurture progression
Track:
- Reactivated contacts
- Clicks to product, application, and case study pages
- Movement toward RFQ-stage content
- Replies
- Sales handoffs
- Re-engagement from dormant opportunities
- Target-account activity after sends
Open rates can help diagnose deliverability or subject-line performance. They should not be the main measure of success.
Email should help known contacts progress.
Website: RFQ conversion rate
Track:
- MQL to SQL to RFQ conversion rate
- Contact-form conversion rate
- Product-page conversion paths
- Application-page engagement
- Form abandonment
- Calls from high-intent pages
- CTA clicks
- Returning target-account visitors
A site with steady traffic and few RFQs may have a conversion problem.
A conversion-rate optimization may be warranted if this is the case. It’s an assessment focused on improving phone calls and form submissions.
Useful review questions include:
- Is the RFQ path easy to find?
- Does the page answer technical questions?
- Do forms request the right amount of detail?
- Do CTAs match the buyer’s stage?
- Do product pages include relevant proof?
- Can buyers contact sales easily?
Executive Dashboard Structure
A useful executive dashboard should fit on one page.
It does not need every chart available in GA4, Search Console, LinkedIn, Google Ads, HubSpot, Salesforce, and the email platform. It should contain the information leadership needs to decide what to continue, change, or stop.
Awareness indicators
Use these to show whether the target market can find the company:
- Organic visibility for priority technical keywords
- Paid search impression share for high-intent campaigns
- Website traffic from target industries
- Brand-search growth
- Visits from target accounts
Engagement indicators
Use these to show whether buyers are spending meaningful time with the company:
- Product and application page engagement
- Case study views
- Technical guide downloads
- Repeat target-account visits
- Email clicks to sales-stage content
- Engagement from several contacts at one company
Conversion indicators
Use these to show buyer action:
- RFQ submissions
- Qualified contact forms
- Qualified phone calls
- Meeting requests
- Consultation or demo requests
- Conversion rate by page type
- Cost per qualified inquiry
Pipeline indicators
Use these to connect marketing with sales results:
- MQL-to-SQL conversion rate
- SQL-to-opportunity conversion rate
- Pipeline influenced
- Opportunity value by source or campaign
- Closed-won influence
- Lost opportunities with relevant marketing notes
This structure follows the buying process and keeps the dashboard tied to decisions.
Common reporting mistakes
Reporting too much
More charts don’t create more clarity.
A dashboard with 40 metrics often signals that no one has decided what matters. Select the measures that reflect the company’s growth strategy, sales cycle, and revenue model.
No agreement between sales and marketing
When marketing and sales use different definitions of a qualified lead, reporting creates arguments instead of decisions.
Agree on:
- What qualifies as an MQL
- What sales must do with an MQL
- What qualifies as an SQL
- What information forms must collect
- What disqualifies a lead
- How sales records lead quality
- How lost opportunities are reviewed
Document the definitions.
Treating all leads equally
A student downloading a guide is different from an engineer submitting an RFQ with a drawing.
Lead reports should separate records by intent, fit, source, and stage. Otherwise, campaigns that generate easy, low-value conversions may appear stronger than campaigns producing fewer and better opportunities.
Ignoring sales-cycle length
Long-cycle marketing looks weak when leadership expects every campaign to produce immediate revenue.
Report early and late indicators separately. Early indicators show whether suitable buyers are engaging. Late indicators show whether that activity becomes pipeline and revenue.
Failing to review lost opportunities
Closed-lost analysis can reveal useful marketing gaps.
Review reasons such as:
- Poor fit
- Missing capability
- Price
- Lead time
- Certification gaps
- Weak technical evidence
- Better competitor documentation
- Unclear differentiation
- Stalled sales conversations
Some losses are unrelated to marketing. Others point directly to weak website copy, missing case studies, unclear product pages, poor comparison content, or friction in the RFQ process.
A practical reporting rhythm
Monthly reporting should lead to action.
A manufacturing scorecard might include:
- Qualified conversions
- RFQs by source and product line
- SQLs created
- Pipeline influenced
- Closed-won influence
- Strongest product or application pages
- Weak conversion paths
- Target-account engagement
- Sales feedback on lead quality
- One decision for the next month
Quarterly reporting can examine:
- Channels producing qualified demand
- Campaigns influencing pipeline
- Technical content used during opportunities
- Sources producing poor-fit leads
- Pages needing conversion work
- Lost deals that reveal content or messaging gaps
- Areas where budget should move
Reporting records what happened. Measurement helps the company decide what to do next.
Build a marketing dashboard sales can trust
When marketing reports rising traffic and clicks while sales continues to report poor lead quality, the dashboard needs to change.
Start with a Website Competitor Analysis to compare your visibility, content, and conversion paths with other industrial companies. It’s free, there’s no obligation and we simply email it to you for you to review. If you have questions, you can give us a call.
Manufacturers that need to connect SEO, content, automation, ABM, and reporting can schedule a Discovery Call with WSI to create a marketing plan that ties the efforts to qualified leads, RFQs, and pipeline.
Frequently Asked Questions About Manufacturing Marketing Metrics
What are the most important manufacturing marketing metrics?
The most useful metrics include qualified website conversions, RFQs, sales-qualified leads, target-account engagement, pipeline influenced, and closed-won source or influence.
Traffic and clicks still provide context, but they should be evaluated alongside lead quality and sales outcomes.
Why are vanity metrics risky for manufacturers?
Vanity metrics can make marketing appear active without showing whether the company is attracting real buyers.
Traffic, clicks, and downloads may increase even when qualified RFQs and sales conversations remain flat.
How should manufacturers measure SEO performance?
Manufacturers should track qualified organic inquiries, RFQs from organic search, visibility for high-intent technical keywords, engagement with product and application pages, and organic-assisted opportunities.
Search Console metrics such as clicks, impressions, click-through rate, and average position are useful when connected to visitor quality.
What is a useful paid search metric for industrial companies?
Cost per qualified inquiry is generally more informative than cost per lead.
Google Ads can calculate cost per conversion, but manufacturers should also evaluate whether the resulting inquiries match target industries, applications, company types, and sales-readiness criteria.
How do RFQs fit into marketing reporting?
RFQs are a strong indicator of buying intent.
Reports should separate RFQs by source, product line, industry, fit, estimated value, quote status, and outcome. This helps leadership identify which channels produce sales-ready demand.
Can attribution show which marketing channel closed a deal?
Attribution can reveal useful patterns, but it cannot provide a complete record of every industrial buying journey.
Google Analytics assigns credit to touchpoints leading to key actions. Offline conversations, distributor referrals, forwarded emails, trade shows, phone calls, and sales notes may fall outside that view. (Google Help)
What belongs in an executive marketing dashboard?
An executive dashboard should include a focused set of awareness, engagement, conversion, and pipeline indicators.
Every metric should support a decision about what is working, what needs attention, or where budget should move.